Excel is often used to collect and analyze business data, but the data you receive is not always ready for analysis. You may have duplicate records, blank rows, inconsistent spellings, incorrect date formats, extra spaces, unnecessary columns, or information spread across multiple files.
Cleaning this data manually can take a lot of time, especially when the same process has to be repeated every week or every month.
This is where Excel Power Query becomes useful.
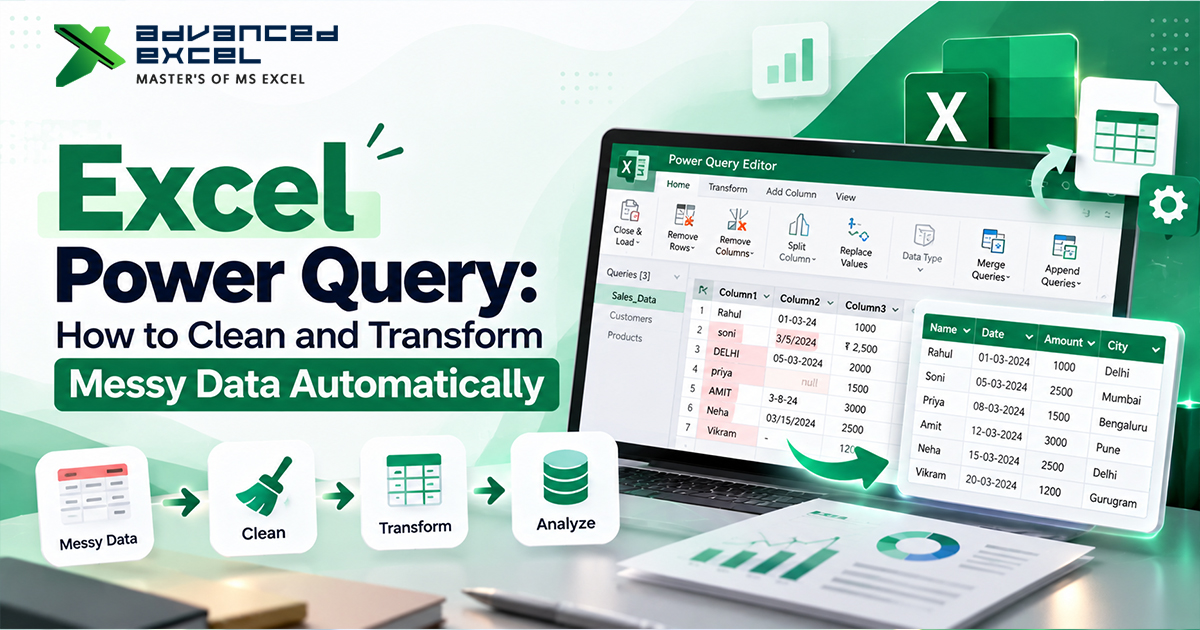
Power Query is an Excel tool designed to import, clean, transform, and prepare data for analysis. Instead of manually repeating the same cleaning steps, you can create a repeatable transformation process and refresh it when new data arrives.
In this guide, we will explain how to use Power Query to clean and transform messy Excel data, the most useful transformations, common mistakes, and how Power Query can make recurring reporting much easier.
What Is Power Query in Excel?
Power Query is a data preparation and transformation tool available in modern versions of Excel.
It can connect to different data sources, bring the data into Power Query Editor, apply transformation steps, and load the cleaned result back into Excel.
For example, Power Query can help you:
- Remove duplicate records
- Remove blank rows
- Clean unnecessary spaces
- Change data types
- Rename columns
- Filter unwanted records
- Split columns
- Merge columns
- Replace incorrect values
- Combine multiple Excel files
- Append multiple tables
- Merge related datasets
- Create calculated or conditional columns
- Unpivot data
- Refresh the same cleaning process when new data arrives
Power Query is particularly useful when the same data-cleaning process needs to be performed repeatedly.
For a broader comparison between Power Query and Power Pivot, you can also read Excel Power Query vs. Power Pivot.
Why Is Power Query Useful for Messy Data?
Imagine receiving a monthly sales file that contains:
- Customer names with extra spaces
- Duplicate transactions
- Dates stored as text
- Different spellings for the same region
- Empty rows
- Unnecessary columns
- Sales values stored in inconsistent formats
You could clean everything manually, but that process may need to be repeated every month.
With Power Query, you can create the transformation process once.
When the next month’s data arrives, you can replace or update the source and refresh the query. The same transformation steps can then be applied again.
This makes Power Query useful for recurring Excel reporting, data preparation, and routine data-cleaning tasks.
How to Open Power Query in Excel
The exact options can vary depending on your Excel version, but Power Query is generally available through the Data tab.
For example, you can start with:
Data ? Get Data
or:
Data ? From Table/Range
If your data is already stored in an Excel Table, selecting From Table/Range opens that data in Power Query Editor.
Once the Power Query Editor opens, you can begin applying transformation steps.
Step 1: Import Your Data into Power Query
Start with the dataset you want to clean.
For example:
| Customer Name | Region | Sales | Date |
| Rahul Sharma | North | 25000 | 01/01/2026 |
| Priya Gupta | north | 18000 | 02/01/2026 |
| Amit Kumar | NORTH | 22000 | 03/01/2026 |
| Rahul Sharma | North | 25000 | 01/01/2026 |
This data already contains some common problems:
- Extra spaces
- Inconsistent capitalization
- A duplicate record
- Potential formatting issues
Select the dataset and choose:
Data ? From Table/Range
Power Query Editor will open with the imported data.
Step 2: Remove Unnecessary Columns
Large datasets often contain columns that are not required for the final report.
For example, a raw sales file may contain:
- Customer ID
- Customer Name
- Address
- Phone
- Salesperson
- Region
- Product
- Quantity
- Sales
- Internal Notes
- Import Timestamp
If the report only needs Customer Name, Region, Product, Quantity, and Sales, unnecessary columns can be removed.
Select the columns you do not need and choose:
Home ? Remove Columns
Removing unnecessary fields can make the final dataset easier to understand and work with.
Step 3: Remove Blank Rows
Blank rows can create problems when data is being analyzed.
In Power Query, you can filter the relevant columns and remove rows that do not contain useful information.
For example, if a row contains no customer or transaction information, it may not need to remain in the final dataset.
Keeping the dataset structured and free from unnecessary blank records makes later reporting easier.
Step 4: Remove Duplicate Records
Duplicate records are another common data-quality problem.
Suppose your sales data contains the same transaction twice.
Power Query can remove duplicate rows based on the columns you select.
For example, you may identify duplicates using:
- Customer ID
- Invoice Number
- Product
- Transaction Date
Select the relevant columns and use:
Home ? Remove Rows ? Remove Duplicates
However, be careful before removing duplicates. Two records that look similar may represent two legitimate transactions.
Always understand what makes a record unique before applying duplicate removal.
Step 5: Clean Extra Spaces
Messy text is extremely common in imported Excel data.
For example:
Rahul Sharma
and
Rahul Sharma
may look almost identical, but the second value contains extra spaces.
Power Query provides text transformation options that can help clean this type of data.
You can use transformations such as:
Transform ? Format ? Trim
You can also use other text-formatting options depending on the requirement.
If you regularly clean names, email addresses, or other text fields, Power Query can make the process much more repeatable.
For another practical example of text cleanup using Power Query, see How to Change Capital Letters to Lowercase in Excel.
Step 6: Standardize Text Values
Inconsistent text values can create problems in reports.
For example:
- North
- NORTH
- north
These may represent the same region but can be treated as different values in analysis.
Power Query allows you to transform text into a consistent format.
Depending on your requirement, you can use:
- UPPERCASE
- lowercase
- Capitalize Each Word
- Trim
- Clean
Standardized text makes filtering, grouping, PivotTables, and reporting more reliable.
Step 7: Change Data Types
Correct data types are important for reliable analysis.
A dataset may contain:
- Dates stored as text
- Numbers stored as text
- Percentage values in the wrong format
- Currency values with inconsistent formatting
Power Query allows you to define the appropriate data type for each column.
Common data types include:
- Text
- Whole Number
- Decimal Number
- Date
- Date/Time
- True/False
For example, if a Sales column is stored as text, calculations may not work as expected.
Select the column and choose the appropriate data type.
Always check your data types before loading the final dataset.
Step 8: Replace Incorrect or Inconsistent Values
Sometimes the same information appears in multiple formats.
For example:
| Region |
| Delhi |
| Delhi NCR |
| New Delhi |
| delhi |
If your reporting requirement treats these as one category, you can use Replace Values to standardize the entries.
Go to:
Transform ? Replace Values
Then specify the existing value and the replacement value.
This is especially useful when data comes from different teams, systems, or files.
Step 9: Split Columns
Sometimes a single column contains multiple pieces of information.
For example:
Rahul Sharma – Delhi
You may want to separate it into:
- Customer Name
- City
Power Query can split a column based on:
- Delimiter
- Number of characters
- Position
- Other available rules
For delimiter-based data, you can use:
Transform ? Split Column ? By Delimiter
This can save significant manual editing time when working with large datasets.
Step 10: Merge Columns
The opposite situation can also occur.
You may have:
| First Name | Last Name |
| Rahul | Sharma |
| Priya | Gupta |
You may want to create a single Full Name column.
Power Query can merge columns and add a separator such as a space.
This can be useful when preparing data for reports, exports, or customer lists.
Step 11: Filter Rows
Power Query allows you to filter records before loading the final data into Excel.
For example, you might want:
- Only 2026 transactions
- Only active customers
- Only one region
- Sales greater than a specific amount
- Records where a required field is not blank
Filtering unnecessary records early can make the final dataset cleaner and easier to analyze.
Step 12: Create Conditional Columns
Power Query can create new columns based on business rules.
For example, suppose you want to classify sales:
| Sales | Category |
| 5000 | Low |
| 25000 | Medium |
| 80000 | High |
You can create a conditional column based on sales value.
For example:
- Less than 10,000 ? Low
- 10,000 to 50,000 ? Medium
- Greater than 50,000 ? High
This can reduce the need for repetitive formulas in the final worksheet.
Step 13: Combine Multiple Excel Files
One of the strongest uses of Power Query is combining data from multiple files.
Imagine you receive:
- January Sales.xlsx
- February Sales.xlsx
- March Sales.xlsx
- April Sales.xlsx
If every file follows the same structure, Power Query can help combine the records into one dataset.
This is much easier than manually opening each workbook, copying the data, and pasting it into a master file.
You can also use Power Query to combine data from multiple worksheets. See How to Build a Single Pivot Table from Multiple Excel Sheets for a practical example of using Power Query for this type of workflow.
Step 14: Append Data in Power Query
Appending means adding rows from one table below another table.
For example:
January Sales
plus
February Sales
plus
March Sales
becomes:
All Sales
This is useful when multiple datasets have the same or similar columns.
Before appending, make sure the column names and data structures are consistent.
If one file uses Sales Amount and another uses Total Sales, Power Query may treat them as different columns.
Step 15: Merge Queries
Merging is different from appending.
A merge is generally used when you want to bring information from another table based on a matching column.
For example:
Sales Table
| Product ID | Sales |
| P101 | 50000 |
| P102 | 35000 |
Product Table
| Product ID | Product Name |
| P101 | Laptop |
| P102 | Monitor |
You can merge the two queries using Product ID and bring Product Name into the sales dataset.
This is similar to using lookup logic, but the transformation happens during data preparation.
Step 16: Unpivot Data
Sometimes data is arranged in a wide format that is difficult to analyze.
For example:
| Product | Jan | Feb | Mar |
| Laptop | 50 | 60 | 70 |
| Monitor | 30 | 40 | 45 |
Power Query can unpivot the month columns to create a more analysis-friendly structure:
| Product | Month | Sales |
| Laptop | Jan | 50 |
| Laptop | Feb | 60 |
| Laptop | Mar | 70 |
| Monitor | Jan | 30 |
This structure is often easier to use with PivotTables, charts, dashboards, and other reporting tools.
Step 17: Load the Cleaned Data Back into Excel
After completing your transformations, select:
Home ? Close & Load
You can load the result into an Excel worksheet or, depending on the workflow, other available destinations.
The important advantage is that the transformation steps are saved with the query.
When new data becomes available, you can refresh the query instead of manually repeating every cleaning step.
How Power Query Automates Data Cleaning
The biggest benefit of Power Query is not simply that it can clean data.
It is that the steps can be saved and repeated.
For example, your process might be:
- Import monthly sales data
- Remove blank rows
- Remove duplicates
- Trim customer names
- Standardize region names
- Change date and number types
- Remove unnecessary columns
- Add a sales category
- Load the cleaned data
- Refresh next month
Once this workflow is created, the next reporting cycle can be much faster.
This is why Power Query is useful for recurring reporting and data preparation.
Power Query for Excel Dashboards
Clean data is the foundation of a reliable dashboard.
If your source data contains duplicate records, inconsistent categories, incorrect dates, or missing values, the dashboard may produce misleading results.
Power Query can be used before PivotTables, PivotCharts, and dashboards to prepare the data.
You can learn more about the complete reporting workflow in this guide to creating an interactive Excel dashboard.
A typical workflow can look like:
Raw Data ? Power Query ? Clean Data ? PivotTable ? Dashboard
This separates data preparation from reporting and can make recurring reports easier to maintain.
Power Query and Power Pivot: What Comes Next?
Power Query and Power Pivot serve different purposes.
Power Query is mainly used to:
- Import data
- Clean data
- Transform data
- Combine data
- Prepare data
Power Pivot is mainly used for:
- Data modeling
- Relationships between tables
- Advanced calculations
- DAX measures
- Large analytical models
A common workflow is:
Source Data ? Power Query ? Power Pivot/Data Model ? DAX ? PivotTable ? Dashboard
If you want to understand the modeling side in more detail, see this Power Pivot and DAX guide.
Power Query vs Manual Data Cleaning
| Task | Manual Excel | Power Query |
| Remove duplicates | Manual/repeated | Saved transformation |
| Remove columns | Manual | Saved transformation |
| Clean text | Formula/manual | Transformation steps |
| Combine files | Copy-paste | Automated query workflow |
| Change data types | Manual | Saved data-type steps |
| Filter records | Repeated | Saved filters |
| Refresh monthly data | Repeat process | Refresh query |
| Repeat same workflow | Time-consuming | Much easier |
The biggest difference is repeatability.
Manual cleaning may work for a small one-time dataset. Power Query becomes much more valuable when the same process needs to be performed repeatedly.
Common Power Query Mistakes to Avoid
1. Loading Dirty Data Without Checking It
Power Query can transform data, but you still need to understand what is wrong with the source data.
2. Using the Wrong Data Type
Incorrect data types can cause calculation and filtering problems.
3. Removing Duplicates Without Understanding the Data
Not every similar-looking record is a duplicate.
4. Ignoring Inconsistent Column Names
When combining files, column names should be standardized.
5. Creating Too Many Unnecessary Steps
Keep your transformation process logical and easy to understand.
6. Not Checking the Final Output
Always review the cleaned data before using it for important reports.
7. Forgetting to Refresh
Power Query becomes useful for recurring workflows only when the query is refreshed with updated source data.
Best Practices for Excel Power Query
For a reliable Power Query workflow:
- Keep your source data structured.
- Use clear column names.
- Check data types early.
- Remove unnecessary columns.
- Remove duplicates carefully.
- Standardize text values.
- Keep transformation steps logically organized.
- Avoid unnecessary transformations.
- Check the final output after every major change.
- Document important queries when other people will maintain them.
- Keep source files in a predictable location when using recurring imports.
- Test the refresh process with updated data.
Real-World Example: Monthly Sales Reporting
Imagine a company receives a new sales file every month.
Each file contains:
- Invoice Number
- Customer
- Product
- Region
- Quantity
- Sales
- Date
The raw files may contain inconsistent spelling, duplicate records, blank rows, and different date formats.
A Power Query workflow could:
- Import the monthly file.
- Remove blank rows.
- Remove duplicate invoices.
- Trim customer names.
- Standardize region names.
- Change Sales to a numeric data type.
- Convert Date to a proper date type.
- Add a sales category.
- Load the cleaned data into Excel.
- Feed the cleaned data into a PivotTable or dashboard.
The next month, instead of rebuilding the process, you can refresh the query after updating the source data.
This is where Power Query can provide a major productivity advantage.
How Power Query Supports Data Analysis
Data cleaning is only one part of the reporting process.
After cleaning and transforming the data, you can use Excel tools such as:
- PivotTables
- PivotCharts
- Excel formulas
- Charts
- Dashboards
- Power Pivot
- DAX
Clean data makes these analysis tools more reliable.
If you are learning Excel for data analysis, understanding the complete data analysis process in Excel can help you see where Power Query fits into the larger workflow.
Frequently Asked Questions
What is Power Query in Excel?
Power Query is an Excel data preparation tool used to import, clean, transform, combine, and prepare data for analysis.
Is Power Query difficult to learn?
The basic Power Query interface is designed around visual transformation steps, so beginners can start with common tasks such as removing duplicates, filtering rows, changing data types, and cleaning text.
Can Power Query remove duplicate data?
Yes. Power Query includes a Remove Duplicates option that can be applied to selected columns or records.
Can Power Query combine multiple Excel files?
Yes. Power Query can be used to combine data from multiple Excel files or worksheets when the data structure is suitable.
Can Power Query replace Excel formulas?
Not completely. Power Query and Excel formulas serve different purposes. Power Query is particularly useful for data import and transformation, while formulas are useful for calculations and dynamic worksheet logic.
Does Power Query automatically update data?
Power Query can refresh a saved query and repeat its transformation steps when updated source data is available. The exact refresh process depends on the source and workbook setup.
Is Power Query better than manually cleaning data?
For one-time small datasets, manual cleaning may be sufficient. For large or recurring datasets, Power Query can make the process much more repeatable and easier to maintain.
Can Power Query be used with Excel dashboards?
Yes. Power Query can prepare and clean the source data before it is used by PivotTables, charts, and Excel dashboards.
Conclusion
Excel Power Query is one of the most useful tools for cleaning and transforming messy data without repeating the same manual process every time.
From removing duplicates and cleaning text to changing data types, combining files, merging tables, and creating repeatable transformation steps, Power Query can make Excel data preparation faster and more consistent.
A practical workflow can look like:
Import ? Clean ? Transform ? Combine ? Load ? Analyze ? Refresh
Once you understand this workflow, Power Query becomes more than a data-cleaning tool. It becomes an important part of a repeatable Excel reporting process.
If you want to develop stronger Excel skills across formulas, data analysis, dashboards, Power Query, and automation, you can explore Advanced Excel & VBA Macros Online Classes.