Data analysis is basically the process of collecting, cleaning, and understanding data so that we can make better decisions. In simple words, it means looking at numbers, information, and records and figuring out what they are really trying to tell us.
Today, data is everywhere. Every business, small or big, is working with data in some form. Sales numbers, customer details, website traffic, marketing reports, all of this is data. But without analysis, this data is just useless information. When we analyze it properly, it becomes powerful.
Most people think data analysis is only for big companies or data scientists, but that’s not true. Even students, small business owners, and office professionals use data analysis daily, sometimes without even realizing it.
Why Is Data Analysis Important?
Data analysis is important because it helps us make decisions based on facts, not guesswork.
Without analysis, we mostly depend on assumptions. With analysis, we know what is actually happening.
Some key benefits are:
-
Better decision-making
-
More clarity in business performance
-
Finding problems early
-
Understanding customers better
-
Reducing risks
-
Improving overall efficiency
For example, if sales are going down, data analysis helps you understand why. Maybe price is high, or maybe marketing is not reaching the right audience, or maybe product demand has changed.
Also Read:
Types of Data Analysis
There are mainly four types of data analysis.
1. Descriptive Analysis
This shows what has already happened.
It answers: What happened?
Examples:
-
Monthly sales report
-
Website traffic report
-
Profit and loss statement
It is the most basic form of analysis.
2. Diagnostic Analysis
This explains why something happened.
It answers: Why did it happen?
Examples:
-
Why did sales drop last month
-
Why has website traffic suddenly increased
It goes deeper into the problem.
3. Predictive Analysis
This predicts what might happen in the future.
It answers: What is likely to happen?
Examples:
-
Sales forecasting
-
Customer behavior prediction
-
Demand forecasting
4. Prescriptive Analysis
This suggests what action should be taken.
It answers: What should we do now?
Examples:
-
Which product to promote
-
What pricing strategy to use
Data Analysis Process (Step by Step)
Step 1: Data Collection
Data can be collected from:
-
Excel files
-
Databases
-
Online forms
-
Websites
-
CRM tools
Step 2: Data Cleaning
This step is essential. Most raw data is messy.
It may have:
-
Missing values
-
Duplicate records
-
Wrong entries
If the data is wrong, the results will also be wrong.
Step 3: Data Transformation
Here, the data is organized:
-
Sorting
-
Filtering
-
Formatting
-
Creating new columns
Step 4: Data Analysis
This is where real work starts:
-
Using Excel formulas
-
SQL queries
-
Calculations
Step 5: Data Visualization
Data is shown using:
-
Charts
-
Graphs
-
Dashboards
This makes information easier to understand.
Step 6: Interpretation
Here we understand results and take action.
Tools Used in Data Analysis
1. Microsoft Excel
Excel is the most common and beginner-friendly tool.
Almost every data analyst starts with Excel.
Excel helps in:
-
Data cleaning
-
Calculations
-
Pivot tables
-
Charts
-
Basic automation
For advancedexcel.net, Excel is the backbone of data analysis learning.
2. Google Sheets
Similar to Excel but online.
Good for teamwork.
3. SQL
Used to extract data from databases.
4. Python
Used for automation and advanced analysis.
5. Power BI / Tableau
Used for professional dashboards and reports.
Real-Life Use of Data Analysis
Data analysis is used in almost every industry:
-
Business – sales, profit, growth
-
Marketing – campaign performance
-
Finance – budgeting, risk management
-
Healthcare – patient data analysis
-
Education – student performance
-
E-commerce – product demand and trends
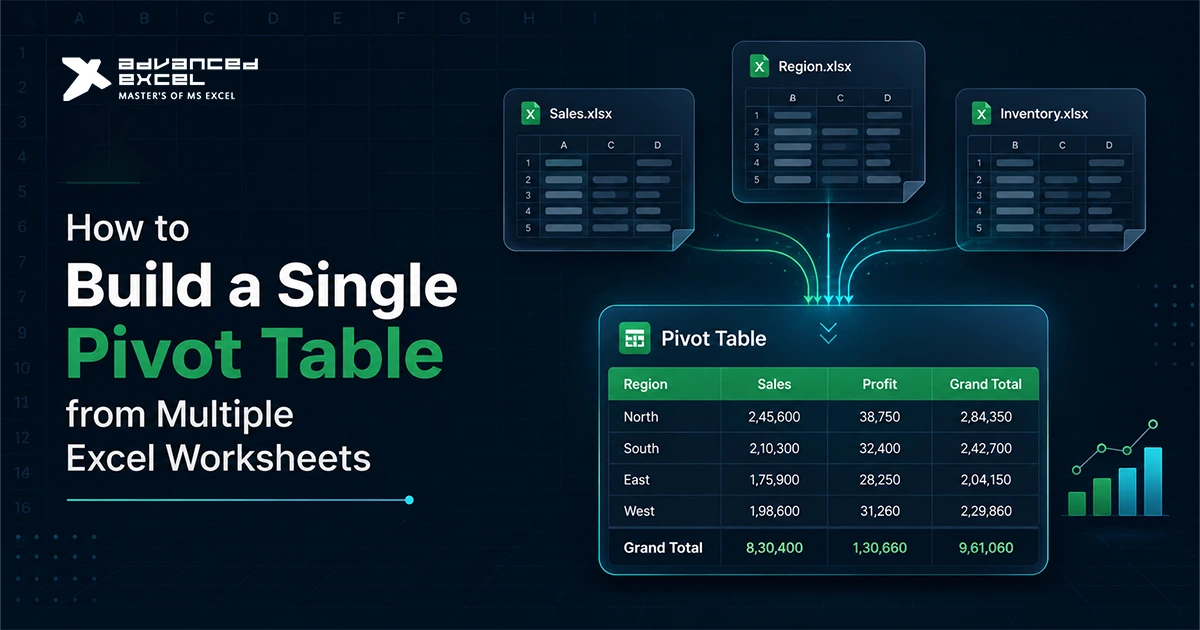
Example of Data Analysis Using Excel
Suppose you have this data:
| Product | Month | Sales |
|---|---|---|
| Laptop | Jan | 50,000 |
| Mobile | Jan | 30,000 |
| Laptop | Feb | 65,000 |
With Excel, you can:
-
Create Pivot Table
-
Compare months
-
Find the top product
-
Create charts
This is real data analysis, simple and practical.
Skills Required for Data Analysis
To start, you need:
-
Basic Excel knowledge
-
Logical thinking
-
Attention to detail
-
Basic math
Later, you can learn:
-
SQL
-
Power BI
-
Python
-
Statistics
Difference Between Data Analysis and Data Analytics
| Data Analysis | Data Analytics |
|---|---|
| Focuses on data understanding | Focuses on strategy |
| Short-term view | Long-term view |
| Excel, SQL | BI tools, AI |
Career in Data Analysis
Popular roles:
-
Data Analyst
-
Business Analyst
-
Reporting Analyst
Industries:
-
IT
-
Banking
-
Marketing
-
Education
-
E-commerce
Why Learn Data Analysis?
Because:
-
High-demand skill
-
Good career growth
-
Useful in every industry
-
Easy to start with Excel
Data Analysis and Advanced Excel
Excel is the first step in data analysis.
Learning:
-
Pivot Tables
-
Power Query
-
Advanced formulas
-
Data cleaning
gives a strong foundation.
Conclusion
Data analysis is not as complicated as people think. It is just about understanding data properly and using it wisely. Even beginners can start with Excel and slowly move towards advanced tools.
If you want better decisions, a better career, and a better understanding of data, learning data analysis is a smart choice.