Excel is not only about formulas, PivotTables and making beautiful reports anymore. When you are working with large amount of data, multiple tables and complicated business reports, normal Excel formulas can become difficult to manage.
This is where Power Pivot and DAX in Excel becomes very useful.
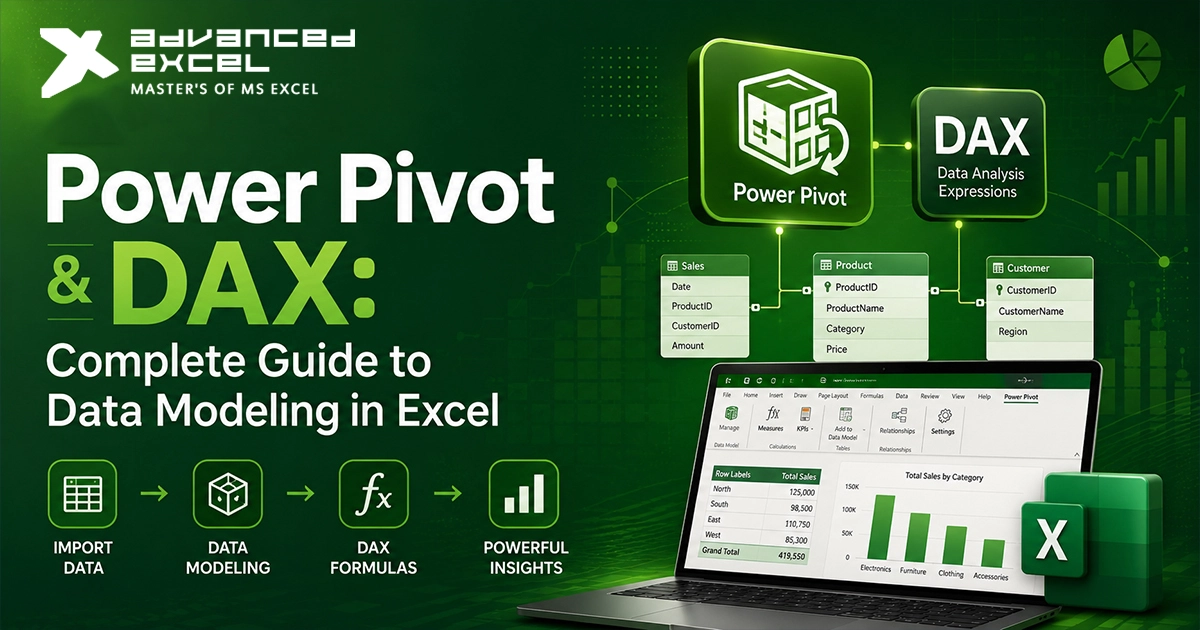
Power Pivot helps you create a proper Data Model by connecting different tables together. DAX, which means Data Analysis Expressions, helps you create advanced calculations, KPIs and business metrics.
In this guide, we will understand Power Pivot, DAX, Excel Data Models, table relationships, measures, calculated columns and some practical examples.
What Is Power Pivot in Excel?
Power Pivot is an Excel feature used for advanced data analysis and data modeling.
With normal Excel, many users keep everything in one big worksheet. But when the data becomes bigger, this approach can create a lot of problems.
For example, a sales reporting system may have:
- Sales transactions
- Products
- Customers
- Employees
- Regions
- Dates
Instead of putting all this information in one huge table, Power Pivot allows you to keep them in separate tables and connect them together.
This makes the Excel workbook more organized and also gives you more powerful reporting possibilities.
What Is an Excel Data Model?
An Excel Data Model is basically a collection of related tables which work together.
For example, you may have a Sales table like this:
| Order ID | Product ID | Customer ID | Date | Sales |
|---|---|---|---|---|
| 1001 | P101 | C001 | Jan-10 | 500 |
| 1002 | P102 | C002 | Jan-11 | 750 |
| 1003 | P101 | C003 | Jan-12 | 420 |
Then you have a Products table:
| Product ID | Product | Category |
|---|---|---|
| P101 | Laptop | Electronics |
| P102 | Monitor | Electronics |
And a Customers table:
| Customer ID | Customer | Region |
|---|---|---|
| C001 | ABC Ltd | North |
| C002 | XYZ Ltd | South |
| C003 | PQR Ltd | West |
Now, instead of repeating product and customer details in every sales row, the tables can be connected using Product ID and Customer ID.
This is the basic idea behind an Excel Data Model.
Power Pivot vs Traditional Excel
In traditional Excel reporting, the process often looks something like:
Raw Data? Formulas? Helper Columns? PivotTable ? Report
With Power Pivot, you can create something more structured:
Data Sources? Power Query? Data Model? Relationships? DAX Measures? PivotTable/Dashboard
This is one of the main reasons why advanced Excel users use Power Pivot.
You don’t have to keep creating the same formulas again and again for different reports.
How Power Pivot Works
A typical Power Pivot workflow can be divided into these steps:
- Import your data.
- Clean the data using Power Query if required.
- Load tables into the Data Model.
- Create relationships between tables.
- Create calculated columns when required.
- Create DAX measures.
- Build PivotTables and PivotCharts.
- Add slicers for interactive reporting.
- Refresh the data when new records are available.
Once the basic model is created, you can use the same model for multiple reports.
How to Create a Data Model in Excel
Let’s take a simple sales example.
Suppose you have three tables:
- Sales
- Products
- Customers
Step 1: Convert Your Data into Tables
First, make sure your source data is properly structured.
Each dataset should have proper column headers and should not contain unnecessary blank rows, merged cells or manual subtotals.
For example:
Sales
Products
Customers
It is better to keep these tables clean from the beginning because messy source data can make your Data Model difficult to manage later.
Step 2: Add Tables to the Data Model
You can add your tables to the Data Model using the Power Pivot options in Excel.
Another common method is to create a PivotTable and select the option to add the data to the Data Model.
Once the tables are added, they become available for creating relationships and DAX calculations.
Step 3: Create Relationships
Now we connect the tables.
For example:
Products[Product ID] ? Sales[Product ID]
and
Customers[Customer ID] ? Sales[Customer ID]
The Sales table contains the transactions, while Products and Customers provide additional information about those transactions.
This type of structure is very common in professional reporting.
Fact Tables and Dimension Tables
If you want to go beyond basic Power Pivot, you should understand Fact Tables and Dimension Tables.
What Is a Fact Table?
A Fact Table normally contains transactions or measurable business events.
Examples include:
- Sales
- Orders
- Expenses
- Inventory transactions
- Payments
A Sales Fact Table could look like:
Date | Product ID | Customer ID | Quantity | Sales Amount
What Is a Dimension Table?
Dimension tables provide descriptive information about the facts.
Examples:
- Product
- Customer
- Employee
- Region
- Calendar
For example, a Product table could contain:
Product ID | Product Name | Category | Brand
A simple model may look like:
Customers ? Sales ? Products
             ?

         **Calendar**
This structure is commonly called a Star Schema.
For advanced Excel reporting, understanding this structure is very useful.
What Is DAX?
DAX stands for Data Analysis Expressions.
It is a formula language used with Power Pivot and other Microsoft data modeling technologies.
If you already know Excel formulas, DAX may look familiar at first.
For example:
Total Sales = SUM(Sales[Sales Amount])
This creates a measure called Total Sales.
But there is an important difference.
DAX calculations work with the Data Model and respond to the filters and relationships in your report.
This is what makes DAX very powerful for dashboards and business reporting.
Excel Formulas vs DAX
A normal Excel formula may look like:
=SUM(E2:E10000)
It directly works with worksheet cells.
A DAX measure can look like:
Total Sales = SUM(Sales[Sales Amount])
The DAX measure doesn’t depend on a fixed worksheet range.
For example, if your PivotTable is filtered to:
- North region
- January
- Electronics
the Total Sales measure will automatically calculate the sales for that selected filter context.
This is a major difference between normal Excel formulas and DAX measures.
Measures vs Calculated Columns
This is one of the most important concepts when learning Power Pivot.
Many Excel users initially get confused between calculated columns and measures.
Calculated Columns
A calculated column calculates a value for every row.
For example:
Profit = Sales[Sales Amount] - Sales[Cost]
If there are 100,000 rows, the calculation is made for each row.
Calculated columns are useful when the result needs to behave like a normal column in the table.
Measures
A measure is calculated dynamically based on the current filter context.
For example:
Total Sales = SUM(Sales[Sales Amount])
If you filter your PivotTable by region, product or year, the measure changes automatically.
For many reporting calculations, measures are the better choice.
Important DAX Functions
After understanding basic measures, you can start learning some of the important DAX functions.
SUM
Used for adding values.
Total Sales = SUM(Sales[Sales Amount])
SUMX
SUMX is useful when you need to perform a calculation for each row and then add the results.
Total Revenue =
SUMX(
    Sales,
    Sales[Quantity] * Sales[Unit Price]
)
This is different from simply using SUM because we are calculating something for each row first.
CALCULATE
If you want to become good at DAX, CALCULATE is one function you really need to understand.
For example:
North Sales =
CALCULATE(
    [Total Sales],
    Customers[Region] = "North"
)
Here, CALCULATE changes the filter context and calculates Total Sales only for the North region.
It looks simple, but CALCULATE can become quite powerful when used with more complicated models.
DIVIDE
Instead of writing a normal division formula:
Profit Margin = [Total Profit] / [Total Sales]
you can use:
Profit Margin =
DIVIDE(
    [Total Profit],
    [Total Sales]
)
DIVIDE is useful because it can handle division-by-zero situations more safely.
DISTINCTCOUNT
This function is useful when you want to count unique values.
For example, unique customers:
Unique Customers =
DISTINCTCOUNT(Sales[Customer ID])
This can be very useful for customer and sales analysis.
Understanding Filter Context in DAX
One of the hardest concepts for new DAX users is Filter Context.
But once you understand it, DAX becomes much easier.
Suppose your PivotTable shows:
| Region | Total Sales |
|---|---|
| North | $250,000 |
| South | $190,000 |
| West | $310,000 |
When Excel calculates the Total Sales for North, it is doing the calculation under the filter context of North.
Now suppose you add a slicer for Product Category and select Electronics.
The same measure now calculates sales based on the selected region and Electronics.
This dynamic behavior is one of the biggest strengths of DAX.
DAX Time Intelligence
Most business reports require date-based calculations.
For example:
- Year-to-Date Sales
- Month-to-Date Sales
- Previous Year Sales
- Year-over-Year Growth
- Rolling 12-Month Sales
- Monthly Growth
To do these calculations properly, it is a good practice to create a separate Calendar table.
For example:
| Date | Year | Month | Month Number | Quarter |
|---|---|---|---|---|
| 01-Jan-2026 | 2026 | January | 1 | Q1 |
| 02-Jan-2026 | 2026 | January | 1 | Q1 |
Then connect:
Calendar[Date] ? Sales[Date]
Having a proper date table makes time-based reporting much more reliable.
Why You Need a Calendar Table
A Calendar table can contain:
- Date
- Year
- Quarter
- Month
- Month Number
- Week
- Day
- Financial Year
For example, instead of using the Sales table’s date directly everywhere, you can use fields from the Calendar table in your PivotTables.
This gives you much better control over time-based analysis.
Power Query + Power Pivot + DAX
These three Excel technologies work very well together.
Think about them as different stages of the same reporting process.
Power Query
Power Query is mainly used for:
- Importing data
- Cleaning data
- Combining files
- Removing unwanted data
- Merging tables
- Appending tables
- Transforming data
Power Pivot
Power Pivot is used for:
- Data modeling
- Relationships
- Data Model
- Advanced analysis
DAX
DAX is used for:
- Measures
- KPIs
- Ratios
- Business calculations
- Time intelligence
- Dynamic calculations
So a professional workflow can look like:
Source Data ? Power Query ? Power Pivot/Data Model ? DAX ? PivotTable ? Dashboard
This is much better than putting hundreds of formulas directly into a report sheet.
Power Pivot Performance Tips
Creating a Data Model is not enough. You also need to make sure your model is efficient.
Remove Unnecessary Columns
If a column isn’t required for your analysis, consider removing it from the model.
For example, you may have 50 columns in your source data but only need 15 of them for reporting.
There is no real benefit in loading everything just because it is available.
Don’t Create Too Many Calculated Columns
Calculated columns can increase the size of your Data Model.
If you can create a calculation as a measure, a measure is often a better option for reporting purposes.
Use Good Table Structure
A clean Data Model is easier to understand and troubleshoot.
Use names such as:
- Sales
- Products
- Customers
- Calendar
instead of unclear names like:
- Sheet1
- Table2
- Data_New_Final2
Good naming actually saves time when the model becomes large.
Common Power Pivot Mistakes
Here are some mistakes that I see Excel users making quite often.
1. Putting Everything in One Table
It may look easier initially, but a large flat table can contain a lot of repeated information.
2. Using Too Many Calculated Columns
Not every calculation needs to be stored row by row.
3. Creating Incorrect Relationships
A wrong relationship can produce wrong results without giving you an obvious error.
4. Not Understanding Filter Context
A DAX formula may be perfectly valid but still give you a result you didn’t expect.
5. Using DAX Without a Proper Data Model
Good DAX cannot fix a poorly designed model.
This is why learning data modeling before advanced DAX is important.
Power Pivot vs PivotTable
Power Pivot and PivotTable are not exactly competing tools.
A PivotTable is mainly used to summarize and display data.
Power Pivot provides:
- Data Model
- Relationships
- DAX
- Advanced calculations
- Multiple related tables
A simple way to remember it is:
PivotTable = Report
Power Pivot = Data Model
DAX = Business Logic
When you combine all three, you can build much more powerful Excel reports.
Power Pivot vs Power BI
Power Pivot and Power BI share many concepts, especially around data modeling and DAX.
If your organization works mainly inside Excel and you need advanced analysis in an Excel workbook, Power Pivot can be a very good option.
Power BI is generally better suited for broader business intelligence, visualization, sharing and cloud-based reporting requirements.
The good thing is that learning Power Pivot and DAX gives you a strong foundation if you later decide to learn Power BI.
When Should You Use Power Pivot?
Power Pivot is a good option when:
- You have multiple related tables.
- Your dataset is very large.
- You need advanced calculations.
- You are creating management reports.
- You need Year-over-Year analysis.
- You want reusable measures.
- You are tired of maintaining complicated worksheet formulas.
- You need interactive reports with PivotTables and slicers.
If your report has become a combination of hundreds of formulas, helper columns and manually updated PivotTables, it might be time to consider a Data Model.
Real-World Example: Sales Dashboard
Let’s say you are working for a company and need to create a sales dashboard.
Your company has:
- 2 million sales transactions
- 10,000 customers
- 5,000 products
- 50 salespeople
- 5 years of sales history
Instead of creating one giant Excel sheet, you can build the following model:
Sales
?
Products
?
Customers
?
Employees
?
Calendar
Then create DAX measures such as:
Total Sales = SUM(Sales[Sales Amount])
Total Profit = [Total Sales] - [Total Cost]
Profit Margin = DIVIDE([Total Profit], [Total Sales])
Unique Customers = DISTINCTCOUNT(Sales[Customer ID])
You can then use these measures in PivotTables and build an interactive dashboard.
This type of setup can make a monthly reporting process much more automated.
Best Practices for Power Pivot and DAX
If you are building professional Excel Data Models, keep these things in mind:
- Keep Fact and Dimension tables properly structured.
- Use meaningful table and column names.
- Create a proper Calendar table.
- Make relationships carefully.
- Use measures for dynamic calculations.
- Remove unnecessary columns.
- Avoid unnecessary calculated columns.
- Use Power Query for data cleaning and transformation.
- Keep DAX measures organized.
- Always test your measures using different filters.
A good Data Model is not just about getting the correct result. It should also be easy for another person to understand and maintain.
Frequently Asked Questions
Is Power Pivot available in Excel?
Power Pivot is available in many modern Excel versions, but availability can depend on the specific Excel edition and Microsoft 365 configuration.
Is DAX difficult to learn?
DAX is not necessarily difficult, but it is different from normal Excel formulas.
The challenging part is usually understanding filter context, relationships and CALCULATE.
If you already have strong Excel knowledge, you have a good starting point.
Can Power Pivot handle millions of rows?
Yes. Excel’s Data Model is designed for working with very large datasets, including millions of rows.
However, the model still needs to be designed properly because unnecessary columns and poor relationships can affect performance.
Is Power Pivot better than PivotTables?
They have different purposes.
PivotTables are mainly for reporting and summarizing data.
Power Pivot provides the underlying Data Model and advanced calculations that can be used by PivotTables.
Should I learn Power Query before Power Pivot?
For most advanced Excel users, learning Power Query first is a good idea.
Power Query handles data preparation, while Power Pivot handles data modeling and DAX handles advanced calculations.
Learning all three together gives you a much stronger Excel skill set.
Final Thoughts
Power Pivot and DAX are two of the most useful technologies for advanced Excel users.
When you start working with multiple tables and large datasets, continuously adding more formulas to your worksheets is usually not the best long-term solution.
A better approach is to build a proper Data Model, create relationships between tables and use DAX measures for your business calculations.
The overall workflow can be:
Power Query ? Data Model ? Power Pivot ? DAX ? PivotTables ? Dashboard
Once you become comfortable with relationships, Fact and Dimension tables, measures, calculated columns, filter context and DAX, you can build Excel reports that are much more powerful than traditional spreadsheet reports.
For anyone who wants to move from an intermediate Excel user to an advanced Excel professional, Power Pivot and DAX are definitely skills worth learning.