Artificial intelligence is changing the way businesses work with data. Traditional business intelligence tools help users analyze information, create dashboards, and make reports. But the next generation of analytics is moving beyond simply answering questions.
With Agentic AI, AI systems can understand goals, reason through data, perform multiple steps, and help users complete tasks with less manual effort.
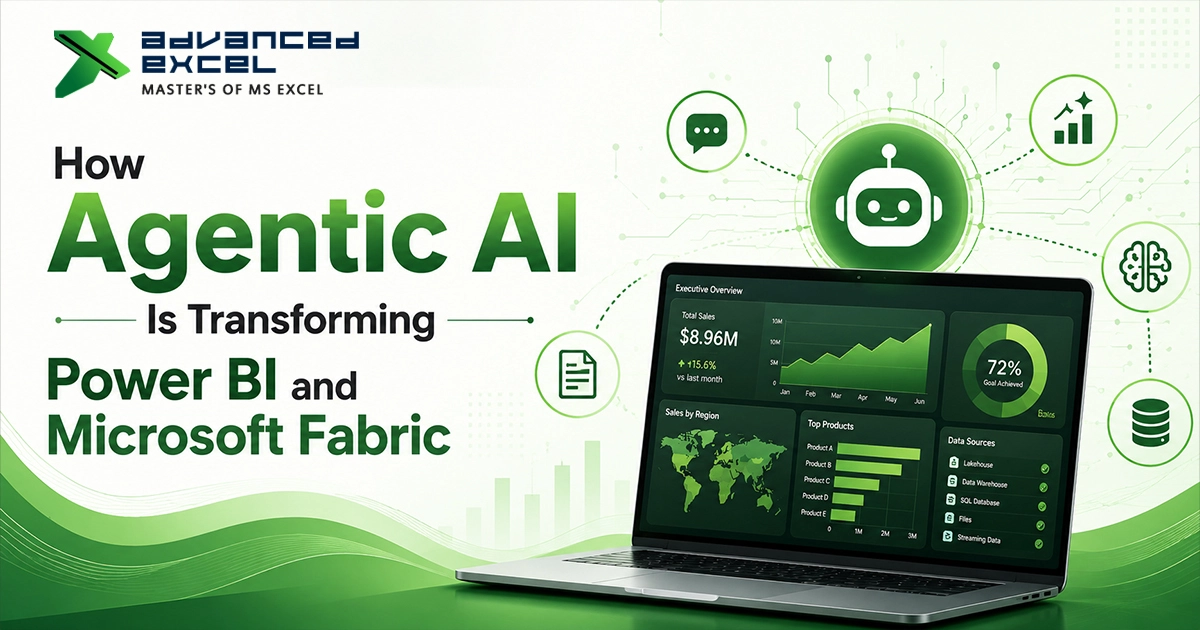
Microsoft is bringing these capabilities into its data and analytics ecosystem through Power BI and Microsoft Fabric. Together, these technologies are creating new possibilities for data analysis, reporting, automation, and business intelligence.
In this guide, we’ll explore what Agentic AI means for Power BI and Microsoft Fabric, how it works, key use cases, benefits, limitations, and what the future may look like.
What Is Agentic AI?
Agentic AI refers to AI systems that can do more than generate a simple response to a prompt.
Traditional AI generally works like this:
User asks ? AI responds
Agentic AI aims to make the process more dynamic:
User provides a goal ? AI analyzes the situation ? AI plans tasks ? AI performs actions ? AI evaluates results
For example, instead of asking:
“What were our sales last quarter?”
An agentic AI system could potentially help with a broader objective such as:
“Analyze our quarterly sales performance, identify the biggest changes, find possible reasons, and prepare a summary for management.”
The system can break a complex request into multiple steps.
This is particularly useful for business intelligence because data analysis often involves several connected tasks.
What Is Microsoft Power BI?
Microsoft Power BI is a business intelligence and data visualization platform used to connect, analyze, and visualize data.
Organizations use Power BI to:
- Create interactive dashboards
- Build reports
- Analyze business performance
- Connect multiple data sources
- Create data visualizations
- Monitor KPIs
- Share insights
- Explore business trends
Power BI has traditionally required users to understand concepts such as data modeling, DAX, Power Query, and visualization design.
AI is changing that workflow.
With AI-powered capabilities, users can interact with business data using more natural language instead of relying entirely on manual analysis.
What Is Microsoft Fabric?
Microsoft Fabric is Microsoft’s end-to-end analytics platform that brings multiple data and analytics workloads together.
It includes capabilities for:
- Data engineering
- Data integration
- Data science
- Data warehousing
- Real-time analytics
- Business intelligence
- Data governance
One of the important concepts within Fabric is OneLake, which provides a unified data foundation across the organization.
Power BI is part of the broader Microsoft Fabric ecosystem.
This means organizations can connect data engineering, data science, data storage, analytics, and business intelligence within a more unified environment.
How Agentic AI Is Changing Power BI
Agentic AI can potentially change Power BI from a tool where users manually build every analysis into a more intelligent environment where AI assists with the analytical process.
Instead of only asking AI to generate a chart, users can give it a business objective.
For example:
“Find the products whose sales have declined significantly and explain the trend.”
An AI-powered workflow could help identify relevant data, analyze trends, and present the findings.
The exact capabilities depend on the Microsoft tools, features, permissions, and AI services available in a particular environment.
1. Natural Language Data Analysis
One of the biggest advantages of AI in business intelligence is the ability to ask questions using natural language.
Instead of writing complex queries or manually filtering a report, users can ask questions such as:
- Which region generated the most revenue?
- What products are declining?
- Which customers have the highest sales?
- What changed compared with last year?
- Which month had the highest profit?
AI can help translate business questions into data analysis.
This makes analytics more accessible to non-technical users.
2. AI-Assisted Report Creation
Creating a Power BI report can involve several steps:
- Connect data
- Clean data
- Build a data model
- Create measures
- Select visualizations
- Design the report
- Add filters
- Validate the results
AI can assist with parts of this process.
Instead of starting with a blank report, users can describe what they want to analyze.
For example:
“Create a sales performance report showing revenue, profit, regional performance, and monthly trends.”
AI-assisted capabilities can help accelerate the creation process.
However, human review is still important to make sure the report uses the correct data and business definitions.
3. Faster Data Exploration
Traditional data analysis often requires users to explore datasets manually.
Agentic AI can make this process more conversational.
For example:
User:
“Why did revenue decrease in March?”
The system could help investigate:
- Regional performance
- Product categories
- Customer segments
- Sales channels
- Previous-period comparisons
This can reduce the time needed to identify potential explanations.
4. AI and DAX
DAX is one of the most important languages in Power BI.
It is used to create measures and calculations such as:
- Revenue
- Profit margin
- Year-over-year growth
- Running totals
- Moving averages
- Rankings
- Time intelligence
For beginners, DAX can be difficult.
AI assistants can help users generate and explain DAX expressions.
For example:
“Create a DAX measure to calculate year-over-year sales growth.”
AI can provide a starting point and explain how the calculation works.
However, generated DAX should always be tested against the underlying data model.
5. Automated Insight Generation
Another important application is automated insight generation.
Instead of waiting for users to discover every trend, AI can help identify patterns such as:
- Unexpected increases
- Sales declines
- Outliers
- Changes in customer behavior
- Regional differences
- Product performance changes
For example, an AI system might identify that:
Sales increased overall, but one major region experienced a significant decline.
This type of insight can help management focus attention on important business questions.
6. Power BI and Microsoft Fabric Working Together
The real opportunity becomes more interesting when Power BI is combined with Microsoft Fabric.
Power BI focuses heavily on business intelligence and visualization, while Fabric brings together broader data workloads.
A typical architecture might look like:
Data Sources ? Fabric ? OneLake ? Data Engineering ? Semantic Model ? Power BI ? AI-Assisted Insights
This creates a connected analytics environment.
Instead of treating dashboards, databases, data pipelines, and analytics as completely separate systems, organizations can bring these workloads into a common platform.
7. Agentic AI for Data Engineering
Agentic AI is not limited to dashboards.
Data engineering is another area where AI can potentially reduce repetitive work.
Data professionals frequently work with:
- Data pipelines
- Data transformations
- SQL
- Data quality
- Data integration
- Monitoring
- Data preparation
AI assistants can help generate code, explain errors, suggest transformations, and accelerate repetitive development tasks.
For example:
“Create a transformation that removes duplicate customer records and standardizes country names.”
AI can provide an initial solution that a data engineer can review and modify.
8. AI-Powered Data Quality
Poor data quality can undermine even the best Power BI dashboard.
Common problems include:
- Duplicate records
- Missing values
- Incorrect formats
- Inconsistent names
- Invalid dates
- Incorrect relationships
AI can help identify unusual patterns and potential data-quality issues.
For example:
“Find columns with unusually high numbers of missing values.”
This can help data teams identify problems earlier in the analytics pipeline.
9. Business Users Can Ask Better Questions
One of the biggest benefits of AI-powered analytics is accessibility.
Previously, a business user might need help from a data analyst to answer a complex question.
With natural-language interfaces, users can increasingly explore information themselves.
For example:
“Which products had the largest profit increase this year?”
Follow-up:
“Now compare those products by region.”
And then:
“Show me the regions where the improvement was lowest.”
This conversational approach can make data exploration more intuitive.
Agentic AI vs Traditional BI
The difference can be summarized simply.
| Traditional BI | Agentic AI-Powered BI |
|---|---|
| User builds the analysis | AI can assist with the analysis |
| Manual exploration | Conversational exploration |
| Fixed dashboards | More dynamic questions |
| User identifies trends | AI can surface potential insights |
| Manual repetitive tasks | Greater automation potential |
| Technical knowledge often required | Natural-language interaction |
| Reactive reporting | More proactive analysis |
Agentic AI doesn’t eliminate traditional BI.
Instead, it can make BI more interactive and assistive.
Power BI, Fabric, and AI: A Typical Workflow
Consider a retail company with millions of sales transactions.
The organization might use:
Step 1: Data Collection
Sales data comes from ERP, CRM, e-commerce, and other systems.
Step 2: Data Integration
Data is brought into Microsoft Fabric.
Step 3: Data Storage
Data is organized within the organization’s Fabric data environment.
Step 4: Data Transformation
Data engineers clean and prepare the information.
Step 5: Semantic Modeling
A Power BI semantic model provides business-friendly definitions and relationships.
Step 6: Visualization
Power BI dashboards present key metrics.
Step 7: AI-Assisted Analysis
Users ask natural-language questions and explore trends.
Step 8: Decision Making
Business teams use the insights to make decisions.
This creates a more connected analytics workflow.
Benefits of Agentic AI in Power BI and Fabric
1. Improved Productivity
AI can reduce repetitive tasks and help users get from a question to an analysis faster.
2. Faster Insights
Users can explore business data using natural language rather than relying entirely on manual filtering and report navigation.
3. Lower Barrier to Analytics
Non-technical users can interact with data more easily.
4. Better Collaboration
Business users, analysts, engineers, and data scientists can use AI-assisted tools within a connected ecosystem.
5. More Scalable Analytics
Organizations can combine large-scale data infrastructure with AI-assisted analysis.
Challenges of Using Agentic AI
Agentic AI also introduces important challenges.
Data Accuracy
AI-generated insights are only as reliable as the underlying data.
If the data is incorrect, the resulting analysis can also be misleading.
Hallucinations and Incorrect Reasoning
AI systems can sometimes produce incorrect explanations or interpretations.
Business-critical results should therefore be validated.
Data Security
Organizations need appropriate security controls when AI interacts with business data.
Governance
Companies need clear rules around:
- Data access
- AI usage
- Model behavior
- Privacy
- Compliance
- Auditability
Human Oversight
AI should support decision-making rather than automatically replace responsible human judgment in high-impact business decisions.
Will Agentic AI Replace Power BI Developers?
Probably not.
Instead, the role of Power BI professionals is likely to evolve.
In the past, much of the work involved:
- Building reports
- Writing DAX
- Creating data models
- Designing dashboards
AI can assist with some of these tasks.
As AI capabilities improve, professionals may spend more time on:
- Data architecture
- Business requirements
- Data governance
- Semantic modeling
- Validation
- Advanced analytics
- AI strategy
- Decision support
The ability to understand the business problem will become even more important.
Will AI Replace Excel and Power BI?
No.
Excel and Power BI serve different purposes.
Excel remains extremely useful for:
- Ad hoc analysis
- Financial modeling
- Calculations
- Data manipulation
- Personal productivity
Power BI is better suited to:
- Interactive dashboards
- Business intelligence
- Data visualization
- Enterprise reporting
Microsoft Fabric extends the ecosystem into broader data and analytics workloads.
AI can enhance all three rather than simply replacing them.
How Excel Users Can Prepare for the Agentic AI Era
If you’re an Excel user, you don’t need to become an AI engineer overnight.
Start by strengthening these skills:
1. Advanced Excel
Learn:
- XLOOKUP
- INDEX/MATCH
- Dynamic arrays
- LET
- LAMBDA
- PivotTables
- Power Query
2. Power BI
Learn:
- Data modeling
- Power Query
- DAX
- Power BI visuals
- Semantic models
3. Microsoft Fabric
Understand the basics of:
- OneLake
- Data Factory
- Data Engineering
- Data Warehouse
- Real-Time Intelligence
4. AI Prompting
Learn how to describe:
- Business problems
- Data requirements
- Desired outputs
- Analytical goals
The combination of Excel + Power BI + Fabric + AI can become a powerful skill set for modern data professionals.
The Future of Power BI and Microsoft Fabric
The future of business intelligence is moving toward more conversational and automated analytics.
Instead of simply opening a dashboard and looking at charts, users will increasingly be able to interact with data through natural language.
Imagine asking:
“Why are sales declining?”
Then:
“Which customers are responsible for most of the decline?”
Then:
“What products are affected?”
Then:
“Prepare a summary I can share with management.”
This represents a shift from dashboard-centric analytics to goal-oriented analytics.
Agentic AI could become an important part of this transformation.
Final Thoughts
Agentic AI is changing how people think about business intelligence.
Power BI provides the visualization and business intelligence layer, while Microsoft Fabric provides a broader platform for bringing together data engineering, integration, analytics, and BI.
Together with AI capabilities, they can help organizations move toward faster, more accessible, and more automated data analysis.
However, AI doesn’t eliminate the need for high-quality data, robust data models, governance, and human expertise.
For Excel and Power BI professionals, the opportunity is clear: don’t compete with AI—learn how to work with it.
The future data professional will not simply build reports. They will use AI to ask better questions, validate insights, automate repetitive work, and turn data into better business decisions.
Frequently Asked Questions
What is Agentic AI in Power BI?
Agentic AI refers to AI systems that can assist with multi-step tasks, reasoning, analysis, and actions based on a user’s goal. In a Power BI environment, this can support more conversational and automated approaches to data analysis.
What is the difference between Power BI and Microsoft Fabric?
Power BI is primarily a business intelligence and visualization platform. At the same time, Microsoft Fabric is a broader analytics platform that brings together data integration, engineering, warehousing, data science, real-time analytics, and Power BI.
Can Agentic AI create Power BI reports?
AI can assist with report creation and analysis, depending on the specific Microsoft tools and capabilities available. Users should review generated reports, calculations, and insights before relying on them for business decisions.
Is Microsoft Fabric useful for Power BI users?
Yes. Fabric can provide a broader data platform around Power BI, helping organizations integrate data engineering, data storage, data transformation, and business intelligence workflows.
Will Agentic AI replace Power BI developers?
Agentic AI is more likely to automate parts of a Power BI professional’s workflow than completely replace the role. Skills such as data modeling, business understanding, governance, validation, and analytical thinking remain important.
Is Agentic AI the future of business intelligence?
Agentic AI is an important emerging direction for business intelligence. It can make analytics more conversational and automate parts of complex workflows, but successful BI still depends on accurate data, reliable models, governance, and human oversight.