Data by itself doesn’t say much. Rows and columns full of numbers can easily confuse people instead of helping them. This is where data visualization becomes important. When data is presented visually, it becomes easier to understand patterns, trends, and insights that are otherwise hidden.
Excel is often seen as a basic tool, but in reality, Advanced Excel offers powerful data visualization capabilities. With the right techniques, Excel can be used to create clear, professional, and decision-ready visual reports.
In this blog, we’ll explore data visualization with Advanced Excel, why it matters, and how you can use Excel tools to turn raw data into meaningful visuals.
What Is Data Visualization?
Data visualization is the process of representing data in visual formats like charts, graphs, dashboards, and tables. Instead of reading numbers, users can quickly understand information through visuals.
In Excel, data visualization helps you:
-
Identify trends and patterns
-
Compare values easily
-
Communicate insights clearly
-
Support better business decisions
Advanced Excel takes this one step further by giving you control, flexibility, and automation.
Why Data Visualization Matters in Excel
Most business decisions are data-driven today. But decision-makers rarely want to see raw data. They want answers.
With proper visualization in Excel, you can:
-
Reduce time spent explaining reports
-
Make presentations more impactful
-
Spot errors and outliers quickly
-
Improve reporting accuracy
This is why data visualization is a core skill for analysts, accountants, managers, and data professionals.
Basic vs Advanced Excel Visualization
Basic Excel users mostly rely on simple charts, such as column or pie charts. Advanced Excel users go much deeper.
Basic Excel Visualization
-
Simple charts
-
Limited formatting
-
Static reports
Advanced Excel Visualization
-
Dynamic charts
-
Interactive dashboards
-
Automated visuals using formulas
-
Data models and Power tools
Advanced Excel helps you build reports that update automatically as data changes.
Key Excel Charts Used for Data Visualization
Excel offers many chart types. Choosing the right one is important.
Column and Bar Charts
Best for:
-
Comparing values
-
Showing growth or decline
Common use cases:
-
Monthly sales
-
Department-wise performance
Line Charts
Best for:
-
Tracking trends over time
Common use cases:
-
Revenue over months
-
Website traffic trends
Pie and Doughnut Charts
Best for:
-
Showing proportions
Use carefully. These work best with limited categories.
Area Charts
Best for:
-
Showing cumulative values over time
Often used in financial and growth analysis.
Combo Charts
Advanced Excel users often combine:
-
Column + Line charts
This helps compare two data sets with different scales in one chart.
Using Conditional Formatting for Visualization
Not all visualization needs charts.
Conditional Formatting allows you to visualize data directly inside cells.
Popular Conditional Formatting Tools
-
Color Scales
-
Data Bars
-
Icon Sets
These are useful when:
-
Working with large datasets
-
Creating performance reports
-
Highlighting top and bottom values
Advanced users combine conditional formatting with formulas for dynamic results.
Creating Dynamic Charts in Excel
Static charts are limited. Dynamic charts change automatically when data changes.
This is done using:
-
Excel Tables
-
Named Ranges
-
OFFSET and INDEX formulas
Dynamic charts are widely used in:
-
Dashboards
-
Monthly reports
-
Automated MIS systems
This is a must-learn skill in Advanced Excel.
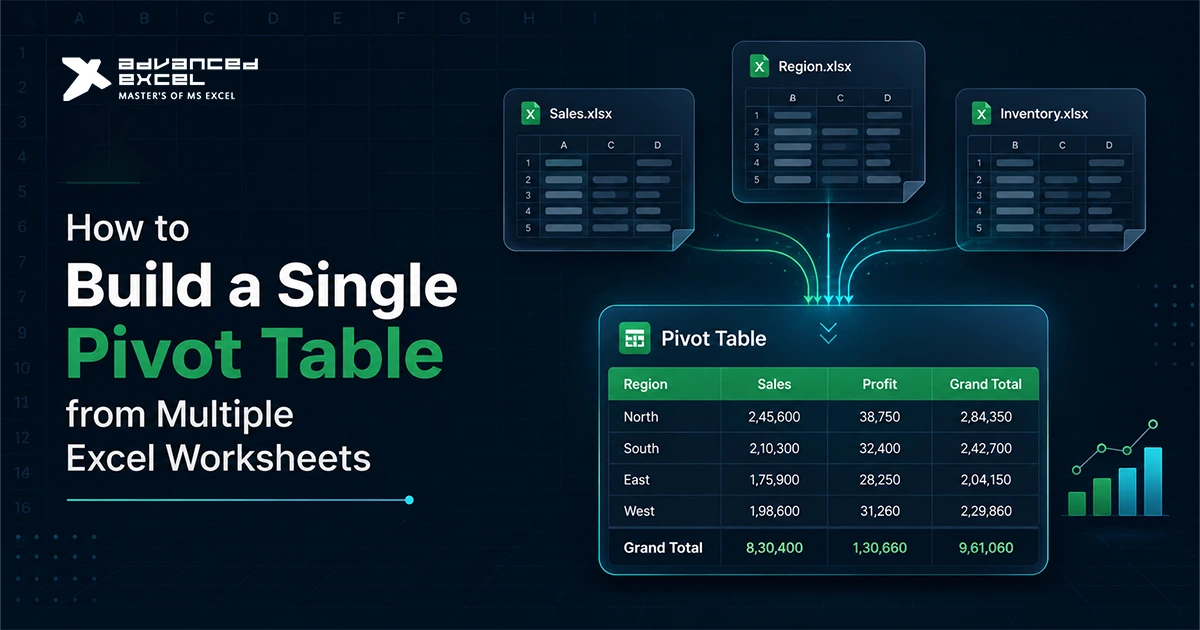
Pivot Charts for Powerful Visualization
Pivot Tables and Pivot Charts are core tools for data analysis and visualization.
With Pivot Charts, you can:
-
Summarize large datasets
-
Filter data interactively
-
Change views instantly
They are perfect for:
-
Sales analysis
-
Financial summaries
-
Performance dashboards
Advanced Excel users often pair Pivot Charts with slicers.
Using Slicers and Timelines
Slicers and timelines make dashboards interactive.
They allow users to:
-
Filter data visually
-
Change reports with one click
For example:
-
Filter sales by region
-
View data for a specific month or year
This makes Excel dashboards feel almost like BI tools.
Advanced Excel Dashboards
A dashboard is a single-screen view that shows key insights.
Components of an Excel Dashboard
-
Charts
-
KPIs
-
Tables
-
Slicers
Dashboards are widely used in:
-
Management reporting
-
Sales tracking
-
HR and finance analysis
Advanced Excel dashboards focus on clarity, not clutter.
Using Excel Functions for Visualization
Advanced visualization often depends on formulas.
Commonly used functions include:
-
IF, IFS
-
SUMIFS, COUNTIFS
-
INDEX and MATCH
-
XLOOKUP
These formulas help:
-
Prepare clean data
-
Create calculated metrics
-
Drive dynamic visuals
Visualization is only as good as the data behind it.
Power Query and Data Visualization
Before visualizing data, it must be clean.
Power Query helps:
-
Remove duplicates
-
Clean messy data
-
Combine multiple files
Once the data is clean, visualization becomes much easier and more accurate.
Power Pivot and Data Models
For very large datasets, Power Pivot is used.
It allows:
-
Working with millions of rows
-
Creating relationships between tables
-
Using DAX measures
Advanced Excel users use Power Pivot to build high-performance visual reports.
Common Mistakes in Excel Data Visualization
Avoid these mistakes:
-
Too many charts on one page
-
Wrong chart selection
-
Poor color usage
-
Overloading dashboards with data
Good visualization is about simplicity and focus.
Real-Life Use Cases of Excel Visualization
Excel data visualization is used in:
-
Business performance tracking
-
Financial forecasting
-
Sales and marketing analysis
-
Inventory management
-
HR analytics
These skills are highly valued in data-related roles.
Why Learn Data Visualization with Advanced Excel?
For learners at advancedexcel.net, data visualization is a must-have skill because:
-
It improves data storytelling
-
It increases job opportunities
-
It prepares you for BI tools like Power BI
-
It builds strong analytical thinking
Advanced Excel remains one of the most demanded tools in the job market.
Conclusion
Data visualization turns raw data into meaningful insights, and Advanced Excel gives you all the tools to do this effectively. From charts and conditional formatting to dashboards, Pivot Charts, and Power tools, Excel can handle far more than people expect.
If you want to move beyond basic spreadsheets and build reports that actually communicate value, mastering data visualization with Advanced Excel is the right step.