Data today is just exploding, and honestly, no business has the time to keep doing repetitive tasks by hand. That’s where automation steps in. It’s not only about saving time, but also about reducing those silly errors we all make when working with large datasets.
Among all tools, Excel, Power BI, and Python are kinda like the top trio for data analysis. If you use them smartly (and in combination), they can make your whole workflow smooth and a lot faster. Let’s see how.
Why Automating Data Analysis Matters
Manual reporting? Yeah, it’s slow and full of mistakes. People spend hours dragging, pasting, and fixing formulas every single week. But in 2025, this approach is just not practical anymore. Businesses need insights right away, not after days of manual work.
By automating the process, data flows from its source straight to the dashboard. It’s clean, consistent, and way less stressful. You set up once, and then the system repeats the process without you lifting a finger.
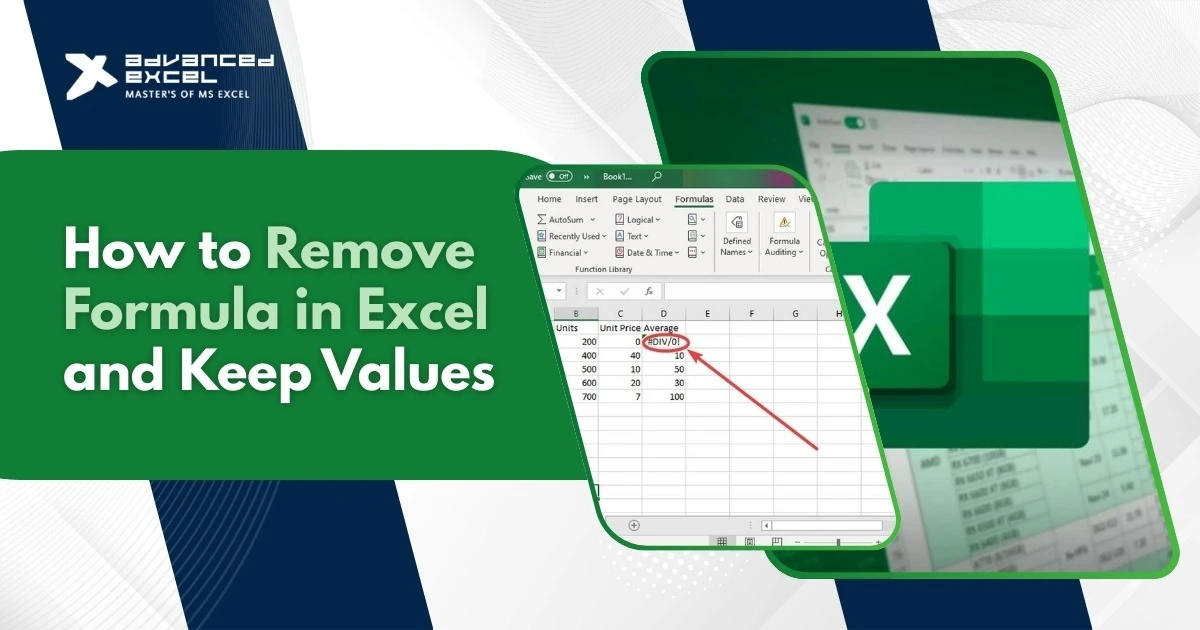
Automating Data Analysis in Excel
Even though Excel’s been around for decades, it’s still one of the most loved tools out there. And truth is, you can automate a surprising amount in it.
-
Macros & VBA: Just record a macro for repetitive stuff like formatting or generating a weekly report. With VBA, you can go further and create scripts that do complex workflows.
-
Power Query: Instead of cleaning data manually every time, Power Query remembers your steps. Next time, just hit refresh and it’s done.
-
Dynamic formulas: Functions like XLOOKUP, FILTER, UNIQUE—they save you from building multiple messy formulas over and over.
Excel might not be the flashiest tool, but for small teams, finance work, or quick reports, it’s still a lifesaver.
Automating Data Analysis in Power BI
While Excel is great for personal work, Power BI automation really shines when you need dashboards for the whole company.
-
Scheduled refresh: Connect it to your database or Excel file, and Power BI will auto-update on its own schedule.
-
Transformations: Like Excel’s Power Query but stronger. Clean and shape your data once, and it keeps applying the rules every time new data comes in.
-
AI insights: Built-in AI features can detect patterns, find anomalies, and even forecast. It feels like having a junior data scientist inside the tool.
So instead of emailing spreadsheets around, managers can just open Power BI and check real-time dashboards. Way more efficient.
Automating Data Analysis with Python
Now if you’re dealing with big data or you want more freedom, Python is where things get interesting. It’s not as “point and click” as Excel or Power BI, but once you know it, it’s powerful.
-
Pandas & NumPy: Great for cleaning, reshaping, or merging massive datasets that Excel would choke on.
-
Visualization: Tools like Matplotlib, Seaborn, or Plotly can generate automated charts and reports.
-
Machine learning: Want predictions, anomaly detection, or clustering? Python’s got endless libraries for that.
-
Integration: You can use Python with Excel (via plugins) or connect it with Power BI for heavy data cleaning before visualizing.
Yes, it has a learning curve, but it’s worth it if you want advanced automation that scales.
Using Excel, Power BI, and Python Together
The real magic happens when you combine all three instead of picking just one.
Here’s how many companies use them:
-
Raw data gets dumped into Excel.
-
Python scripts clean and process the data automatically.
-
Cleaned data is then pushed into Power BI dashboards for visualization.
This way, you don’t waste time fixing errors or copy-pasting. The whole process is streamlined, from data entry to decision-making.
Key Benefits of Data Analysis Automation
-
Saves hours of manual work.
-
Cuts down human errors.
-
Works even with large, messy datasets.
-
Gives real-time dashboards for faster decisions.
-
Lets analysts focus more on insights, not grunt work.
Final Thoughts
In 2025, businesses that keep depending on manual reporting will fall behind, plain and simple. Excel, Power BI, and Python together give a full solution—from input to automation to reporting.
If you’re still stuck updating spreadsheets every week, maybe it’s time to rethink. Start with small Excel automations, then move to Power BI for dashboards, and later add Python when you need more advanced stuff. The earlier you automate, the faster you’ll see the benefits.
FAQs(Frequently Asked Questions)
Q1. Can Excel fully automate data analysis?
It can automate small to medium tasks with macros and Power Query, but for big data, it has limits.
Q2. Why use Power BI for automation?
It updates dashboards automatically and is designed for company-wide reporting.
Q3. Is Python harder to learn?
Yes, a bit. But once you pick it up, it’s the most flexible automation tool.
Q4. Can I use Excel, Power BI, and Python together?
Absolutely, many companies use Excel for input, Python for processing, and Power BI for dashboards.